Data & badges
Every figure on this site is published as machine-readable JSON. No
registration, no API key, no authentication. Responses carry an open
Access-Control-Allow-Origin header, so they can be fetched straight from a
browser.
The daily archive is append-only: one record is added per calendar day and is never rewritten or pruned. Records run from to . The whole archive is also served as one file, in JSON or CSV, so reading the full series takes a single request rather than one per day.
Records predating the pipeline were reconstructed from the same primary sources and carry
backfilled: true; the methodology page
explains exactly how they differ from observed records. Per-chain fees are stored to six
significant figures, so the cheapest rails appear in exponent form (4.79962e-7) rather
than rounding away to zero.
The pipeline samples hourly, and every run is kept alongside the daily archive. The hourly series is the same measurements at finer grain — useful for intraday variation, and the reason the chart above has shape while the daily archive is still short. The daily record remains the citable one.
Endpoints
| URL | Contents | Format |
|---|---|---|
/data/latest.json |
The current snapshot — every figure on the site, with per-source provenance | JSON |
/data/history/<date>.json |
One compact record per day, append-only | JSON |
/data/history.json |
Every archived record in one file, oldest first | JSON |
/data/history.csv |
The same archive as a flat table: one row per day, one fee column per rail | CSV |
/data/intraday.json |
Every pipeline run, one record per hour, oldest first | JSON |
/data/intraday.csv |
The hourly series as a flat table: one row per run, one fee column per rail | CSV |
/data/SCHEMA.md |
Field-by-field schema reference | Markdown |
/feed.xml |
Daily observations as a syndication feed | Atom |
/badge.svg |
The live index as a self-contained image (see embedding) | SVG |
/badge/<chain>.svg |
One network's transfer cost as an image, one file per tracked rail | SVG |
Badges
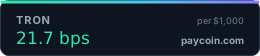
The index and each tracked network are published as self-contained SVGs, about a kilobyte each, with no scripts and no tracking. They are regenerated on every hourly rebuild, so an embedded badge always shows the current figure.

Embedding instructions, the per-network list and the HTML and Markdown snippets.
What the snapshot contains
The top-level keys of latest.json, with the full field-by-field reference in
SCHEMA.md:
index— the Paycoin Index: the supply-weighted average transfer fee, and the same figure in basis points of $1,000.costs— the estimated USD fee for one stablecoin transfer, per chain.stablecoins— USDT and USDC circulating supply, broken down by chain.gasandprices— the raw fee inputs and native-token USD prices the cost estimates are computed from, so every figure can be recomputed independently.regulation— items from official regulator feeds.sources— per-source fetch status:ok,fetchedAtandstale.
Update cadence and stale data
The pipeline runs hourly: it re-fetches every source, recomputes the figures and rebuilds the
site. latest.json reflects the most recent hourly run; the archive keeps one
consolidated record per UTC day.
Failed fetches never fabricate data. If a source is unreachable its previous value is carried
forward with sources[name].ok = false; once that value passes the 48-hour staleness
threshold, stale becomes true and the site shows a visible stale
badge. Treat stale as a signal to discount the affected figures.
How to cite
The figures change every hour, so a citation is only reproducible if it names the record it
refers to. Cite the dated archive file rather than latest.json:
Paycoin Index, “Daily observations of stablecoin transfer costs”, record for 2026-10-30. https://paycoin.com/data/history/2026-10-30.json
Every figure is derived from the cited public sources listed in the methodology, which also gives the exact formulas. If you publish a figure from this dataset, a link back to the record you used lets your readers check it.
Terms
The data is provided as-is, for informational purposes, with no warranty and no service-level commitment — see the terms of use. It is not financial advice.